
Paper/ Subject Code 86001/ Operation Research
TYBMS SEM 6
Operation Research
(Q.P. April 2023 with Solution)

1) April 2019 Q.P. with Solution (PDF)
2) November 2019 Q.P. with Solution (PDF)
4) April 2023 Q.P. with Solution (PDF)
Please check whether you have got the right question paper.
Note:
1. All questions are compulsory. (Subject to Internal Choice)
2. Figures to the right indicate full marks
3. Use of non-programmable calculator is allowed and mobile phones are not allowed.
4. Normal distribution table is printed on the last page for reference. Support your answers with diagrams / illustrations, wherever necessary
6. Graph papers will be supplied on request.
_________________________________________________

Q.1 A) State whether following statements True or False:(Attempt any8) (8)
Q.1B) Match the right and closely related answer from Column Y with the text / term given in Column X. ( Attempt Any 7 questions )
|
Column X |
Column Y |
|
1) Leaner relationship of Variable |
a) Completely utilized resources |
|
2) Infeasible region |
b) Minimum cost in the table |
|
3) Scarce resource |
c) No feasible solution Possible |
|
4) LCM |
d) LPP |
|
5) NWCR |
e) In the game, gains of the winner are equal to
total losses of all other players |
|
6) Critical Activity |
f) Optimistic time |
|
7) Zero sum game |
g) Fair game |
|
8) Shortest activity time in PERT |
h) Zero float value |
|
9) Value of game =0 |
i) The time during which a machine is waiting or not
working |
|
10) Ideal time |
j) Top left side corner of the side |
|
Column X |
Column Y |
|
1) Leaner relationship of Variable |
d) LPP |
|
2) Infeasible region |
c) No feasible solution Possible |
|
3) Scarce resource |
a) Completely utilized resources |
|
4) LCM |
b) Minimum cost in the table |
|
5) NWCR |
j) Top left side corner of the side |
|
6) Critical Activity |
f) Optimistic time |
|
7) Zero sum game |
e) In the game, gains of the winner are equal to total losses of all other players |
|
8) Shortest activity time in PERT |
h) Zero float value |
|
9) Value of game =0 |
g) Fair game |
|
10) Ideal time |
i) The time during which a machine is waiting or not working |

|
Material |
Condenser |
Transmitter |
Conductor |
Availability |
|
Engineering |
1 |
1 |
1 |
100 |
|
Direct
labour |
10 |
5 |
4 |
600 |
|
Administration
service |
2 |
6 |
2 |
300 |
|
Required |
100 |
1000 |
1000 |
|
Let X1 : No. of unit of condenser
produce
X2 : No. of unit of Transmitter
produce
X3 : No. of unit of Conductor
produce
Max Z: Profitable of material produce
Max Z: 10 X1 + 16 X2 +
4 X3
Subject Constraints:
X1
+ X2 + X3 ≤ 100 ---
[Engineering hours]
10 X1
+ 5 X2 + 4 X3 ≤ 600 ---- [Direct labour hour]
2
X1 + 6 X2 + 2 X3 ≤ 300 --- [Administration service hours]
X1
, X2 , X3 ≥ 0
Material | Condenser | Transmitter | Conductor | Availability |
Engineering | 1 | 1 | 1 | 100 |
Direct labour | 10 | 5 | 4 | 600 |
Administration service | 2 | 6 | 2 | 300 |
Required | 100 | 1000 | 1000 |
Let X1 : No. of unit of condenser produce
X2 : No. of unit of Transmitter produce
X3 : No. of unit of Conductor produce
Max Z: Profitable of material produce
Max Z: 10 X1 + 16 X2 + 4 X3
Subject Constraints:
X1 + X2 + X3 ≤ 100 --- [Engineering hours]
10 X1 + 5 X2 + 4 X3 ≤ 600 ---- [Direct labour hour]
2 X1 + 6 X2 + 2 X3 ≤ 300 --- [Administration service hours]
X1 , X2 , X3 ≥ 0
Max Z: 10 X1 + 16 X2 + 4 X3
Subject Constraints:
X1 + X2 + X3 ≤ 100 --- [Engineering hours]
10 X1 + 5 X2 + 4 X3 ≤ 600 ---- [Direct labour hour]
2 X1 + 6 X2 + 2 X3 ≤ 300 --- [Administration service hours]
X1 , X2 , X3 ≥ 0
|
Salesman |
Territory |
||||
|
T1 |
T2 |
T3 |
T4 |
T5 |
|
|
S1 |
26 |
14 |
10 |
12 |
9 |
|
S2 |
31 |
27 |
30 |
14 |
16 |
|
S3 |
15 |
18 |
16 |
25 |
30 |
|
S4 |
17 |
12 |
21 |
30 |
25 |
|
S5 |
20 |
19 |
25 |
16 |
10 |
Salesman | Territory | ||||
T1 | T2 | T3 | T4 | T5 | |
S1 | 5 | 17 | 21 | 19 | 22 |
S2 | 0 | 4 | 1 | 17 | 15 |
S3 | 16 | 13 | 15 | 6 | 1 |
S4 | 14 | 19 | 10 | 1 | 6 |
S5 | 11 | 12 | 6 | 15 | 21 |
Salesman | Territory | ||||
T1 | T2 | T3 | T4 | T5 | |
S1 | 0 | 12 | 16 | 14 | 17 |
S2 | 0 | 4 | 1 | 17 | 15 |
S3 | 15 | 12 | 14 | 5 | 0 |
S4 | 13 | 18 | 9 | 0 | 5 |
S5 | 5 | 6 | 0 | 9 | 15 |
Salesman | Territory | ||||
T1 | T2 | T3 | T4 | T5 | |
S1 | 0 | 12 | 16 | 14 | 17 |
S2 | 0 | 4 | 1 | 17 | 15 |
S3 | 15 | 12 | 14 | 5 | 0 |
S4 | 13 | 18 | 9 | 0 | 5 |
S5 | 5 | 6 | 0 | 9 | 15 |
Salesman | Territory | ||||
T1 | T2 | T3 | T4 | T5 | |
S1 | 0 | 12 | 16 | 14 | 17 |
S2 | 0 | 4 | 1 | 17 | 15 |
S3 | 15 | 12 | 14 | 5 | 0 |
S4 | 13 | 18 | 9 | 0 | 5 |
S5 | 5 | 6 | 0 | 9 | 15 |
Salesman | Territory | ||||
T1 | T2 | T3 | T4 | T5 | |
S1 | 0 | 12 | 16 | 14 | 17 |
S2 | 0 | 0 | 1 | 17 | 15 |
S3 | 15 | 12 | 14 | 5 | 0 |
S4 | 13 | 18 | 9 | 0 | 5 |
S5 | 5 | 6 | 0 | 9 | 15 |
|
Salesmen |
Territory |
Sales
(Rs. Lacs) |
|
S1 S2 S3 S4 S5 |
T1 T2 T3 T4 T5 |
26 27 30 30 25 |
|
Optimal Sales
= Rs. 138 Lacs |
Subject to constraints:
4x1 + 3x2 < 24
x1 < 4.5
x2 < 6
x1 , x2 > 0

Q.3 A) From the data given below:
1. Draw a diagram (2)
2. Find Critical Path (2)
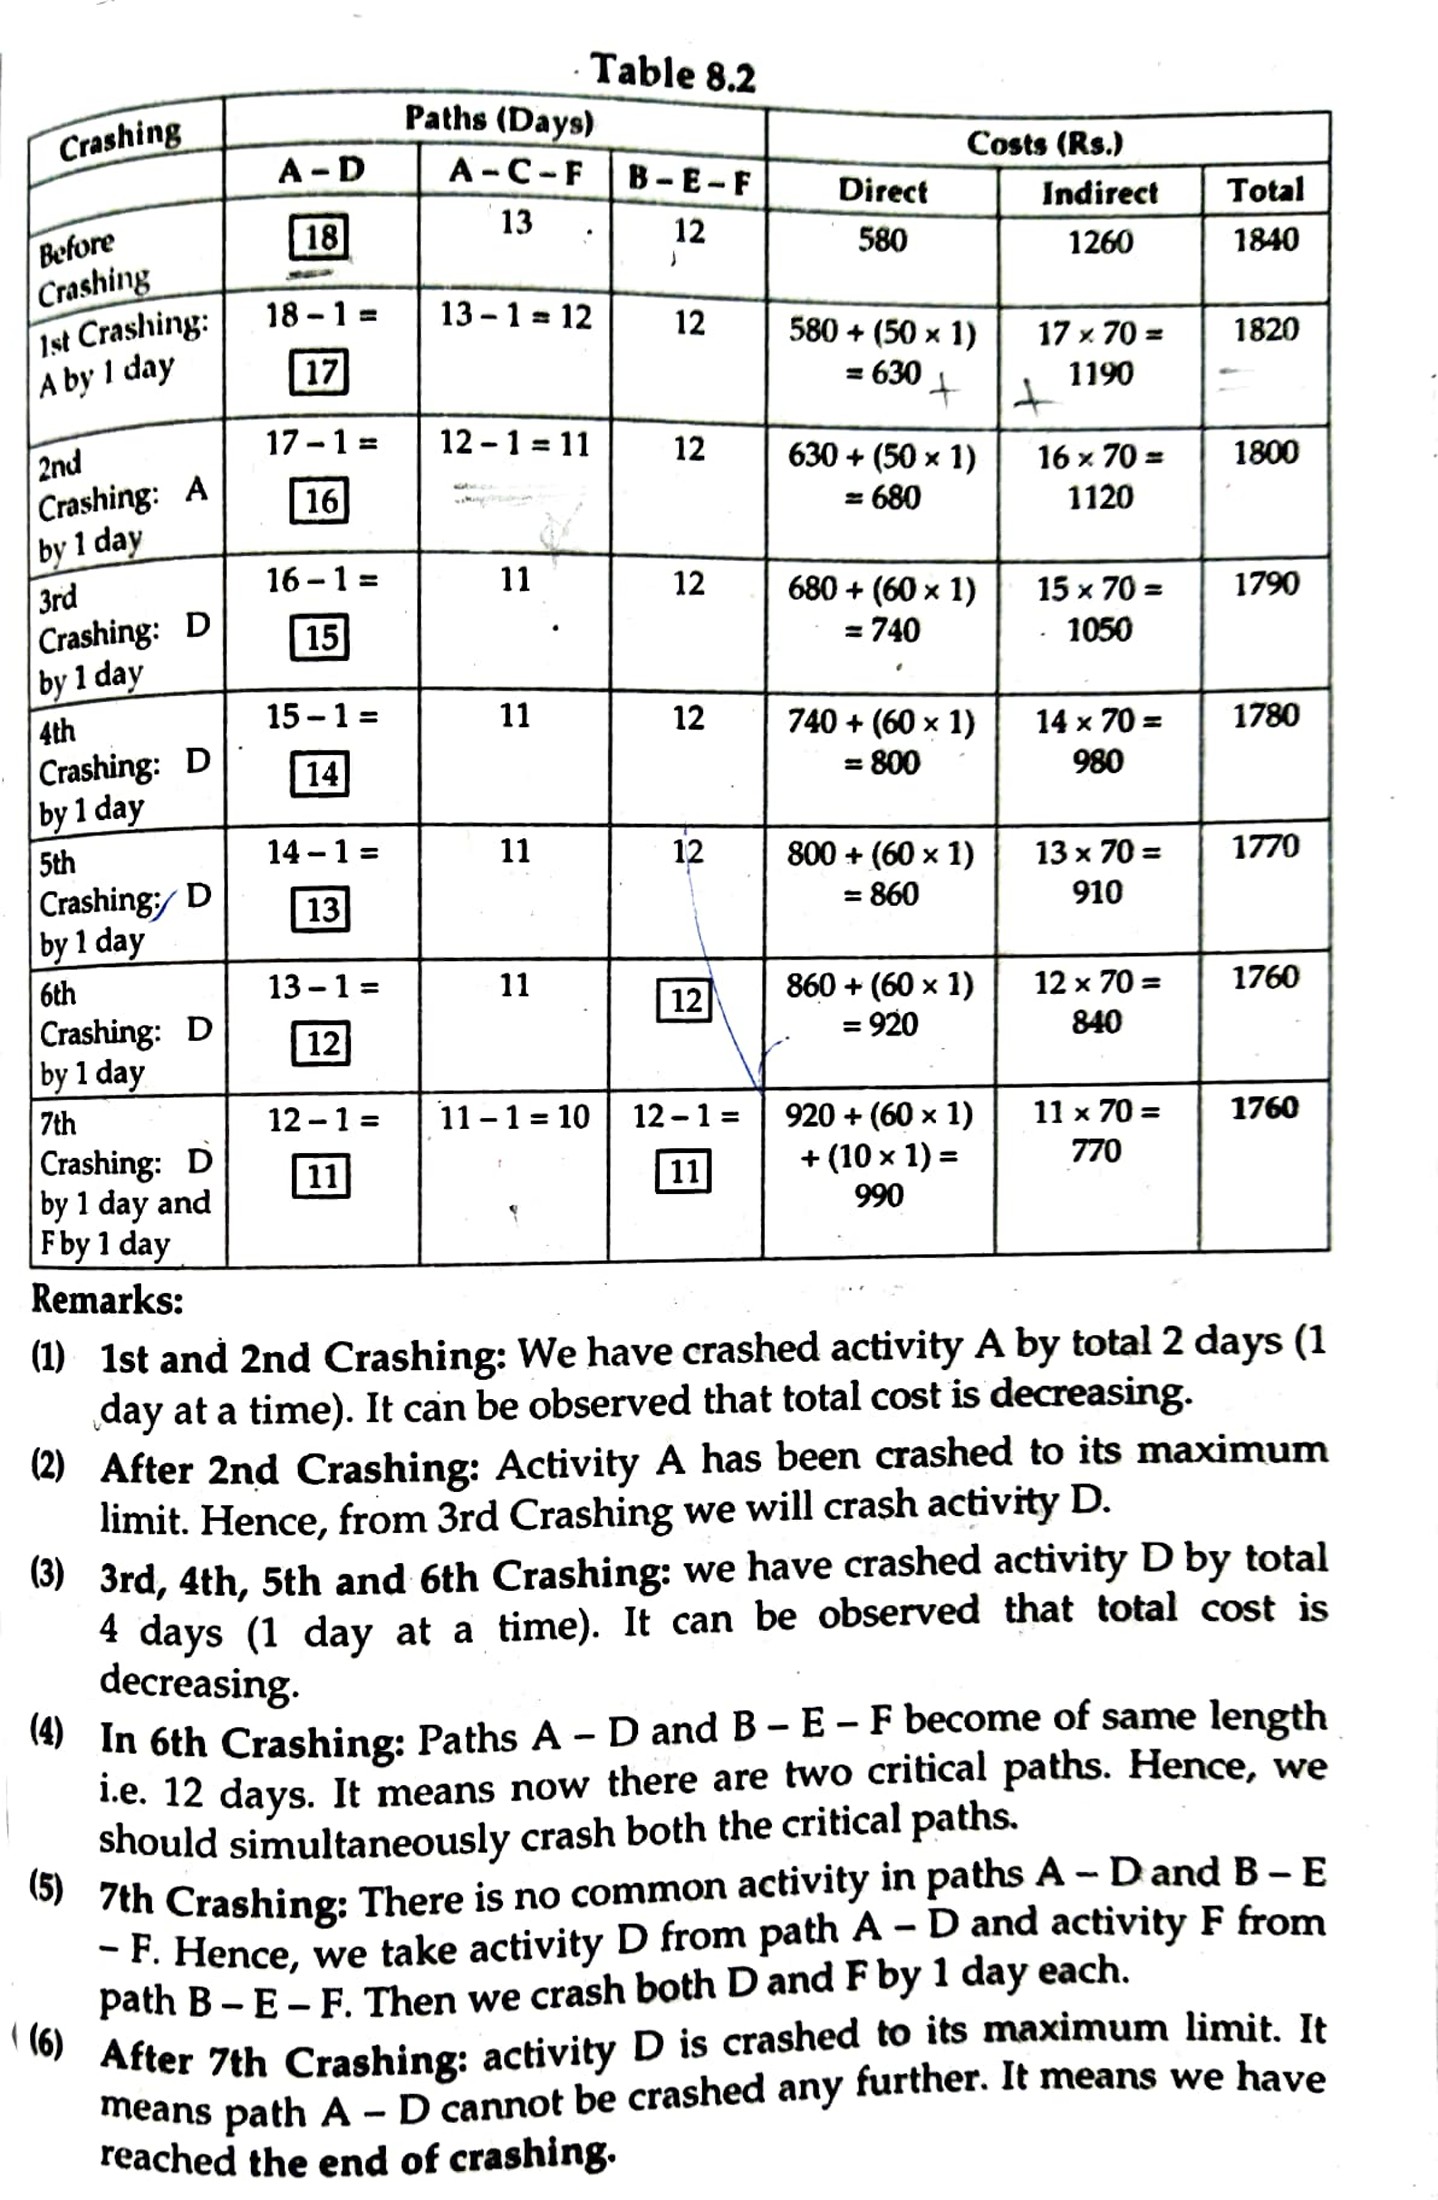
3. Crash Systematically the activities any determine optimal project duration: (4)
|
Activities |
1-2 |
1-2 |
2-4 |
2-5 |
3-4 |
4-5 |
|
Normal time |
8 |
4 |
2 |
10 |
5 |
3 |
|
Normal cost |
100 |
150 |
50 |
100 |
100 |
80 |
|
Crash time |
6 |
2 |
1 |
5 |
1 |
1 |
|
Crashed cost |
200 |
350 |
90 |
400 |
200 |
100 |
Indirect cost is Rs. 70 per day


_1.jpg)
|
Activities |
Average Expected Time
in weeks (te) |
Standard deviation |
|
1-2 |
3 |
4/6 |
|
1-3 |
4 |
4/6 |
|
2-5 |
5 |
4/6 |
|
2-4 |
6 |
2/6 |
|
5-6 |
7 |
4/6 |
|
4-6 |
8 |
4/6 |
|
3-6 |
9 |
4/6 |
|
6-7 |
3 |
2/6 |
_1.jpg)
_2.jpg)
_1.jpg)
- Find the Maximin strategy.
- Find the Minimax strategy.
- What is the Value of the game.
_1.jpg)
Q.4 B) Six jobs I, II, III, IV, V and VI are to be processed on two machine A and B in order AB
Jobs
Processing
Time (Min.)
Machine
A
Machine
B
I
5
8
II
2
6
III
10
3
Iv
9
4
V
6
3
VI
8
9
(i) Find the sequence that minimizes the total elapsed time required to complete the jobs. (2)
(ii) Calculate the total elapsed time. (3)
(iii) Idle time on for each Machine. (3)
Jobs
Processing
Time (Min.)
Machine
A
Machine
B
I
5
8
II
2
6
III
10
3
Iv
9
4
V
6
3
VI
8
9
OR
Q.4 C) Find the optimal sequence: (8)
Jobs
I
II
III
IV
V
Machine A
3
8
7
5
2
Machine B
3
4
2
1
5
Machine C
5
8
10
7
6
Jobs
I
II
III
IV
V
Machine A
3
8
7
5
2
Machine B
3
4
2
1
5
Machine C
5
8
10
7
6
a) Determine the optimum sequence for performing jobs
b) Total minimum elapsed time
c) Idle time for each machine.
Video Solution;


Q4 (D) you are given the following pay-off matrix of a zero-sum game, determine optimal strategies for the players and the value of the game. (7)
|
A
Strategy |
B
Strategy |
|||
|
|
B1 |
B2 |
B3 |
B4 |
|
A1 |
5 |
-4 |
5 |
9 |
|
A2 |
6 |
2 |
0 |
-3 |
|
A3 |
9 |
15 |
10 |
11 |
|
A4 |
2 |
8 |
-6 |
5 |

Q.5 A) Define Operations Research. Explain limitation of Operation Research.
Ans: Quantitative techniques can be classified in two groups, statistical techniques and programming techniques.
B) Explain various cost involved in project crashing.


OR
Q.5 C) Write a Short note (Attempt three): (15)
i) Project crashing.
ii) Basis and non-basis variable in simplex table
Ans: (a) Basis variables: Basis variables in a simplex table mean those variables which are present in the basis of that simplex table. These are the variables which are in that particular solution.
(b) Non basis variables: Non basis variables in a simplex table mean the variables which are not in the basis of that simplex table. These are the variables which are not a part of that particular solution. In the test of optimality, we determine if it is possible to improve the solution by replacing one of the basis variables with one of the non- basis variables.
iii) Interfering float
Ans: Interfering float: It is that part of total float which reduces the float of a subsequent activity. It is the amount of time by which the earliest possible start of a subsequent activity will be delayed if activity ij finishes on latest finishing time.
Interfering float = Latest finishing time of activity ij - Earliest starting time of subsequent activity.
Interfering Float = Lj - Ej
iv) Objectives of critical path
The critical path method (CPM) is a project management technique used to identify the sequence of tasks that determine the minimum duration required to complete a project. The critical path represents the longest path through a project network diagram and determines the shortest possible project duration. The primary objectives of identifying and analyzing the critical path include:
1. Determining Project Duration: By identifying the critical path, project managers can determine the shortest possible duration required to complete the project. This information is crucial for planning and scheduling resources effectively.
2. Resource Allocation: Understanding the critical path helps in allocating resources efficiently. Tasks on the critical path cannot be delayed without extending the project's overall duration. Thus, it is essential to ensure that sufficient resources are allocated to critical tasks to prevent delays in the project timeline.
3. Task Prioritization: Tasks on the critical path are critical to the project's success. Therefore, they require special attention and priority in terms of monitoring, management, and resource allocation. By identifying the critical path, project managers can focus their efforts on managing these critical tasks to keep the project on track.
4. Risk Management: The critical path highlights tasks that are most susceptible to delays. By focusing on these critical tasks, project managers can proactively identify potential risks and develop strategies to mitigate them. This helps in minimizing the likelihood of delays and ensuring successful project completion.
5. Schedule Compression: Knowing the critical path allows project managers to identify opportunities for schedule compression. By focusing on critical tasks or adding resources to critical activities, project managers can accelerate the project timeline without affecting its overall duration.
v) NWCM
Ans: Northwest Corner Method (NWCM)
The Northwest Corner Method is a technique used in transportation and distribution problems to find an initial feasible solution. It is named as such because it begins by allocating as much as possible starting from the northwest corner of the transportation tableau.
Here's a brief overview of the Northwest Corner Method:
1. Initial Allocation: The method starts at the top-left (northwest corner) cell of the transportation tableau. It allocates as much as possible to satisfy the supply and demand constraints while minimizing transportation costs.
2. Move to the Next Cell: After allocating the maximum possible amount in the northwest corner cell, the method moves to the next cell along the same row or column. The process continues iteratively, moving either horizontally or vertically, until one of the supply or demand constraints is exhausted.
3. Iteration: The method iterates through the remaining cells, allocating quantities based on the remaining supply and demand constraints, always moving from the current allocation to the next available cell in the direction of the unfulfilled constraint.
4. Completing Allocation: The allocation process continues until all supply and demand requirements are met. At this point, the initial feasible solution is obtained.
5. Optimizing the Solution: While the Northwest Corner Method provides an initial feasible solution, it may not be optimal. Further optimization techniques such as the stepping stone method or the modified distribution method can be applied to improve the solution and minimize transportation costs.
The Northwest Corner Method provides a simple and straightforward approach to initially solving transportation and distribution problems. However, it may not always yield the most efficient solution, so additional optimization methods are often employed to refine the solution further.
Elective: Operation Research (CBCGS) | |||
Year | Month | Q.P. | Link |
IMP Q. |
|
| |
Obj. Q |
|
| |
2019 | April | ||
2019 | November | ||
2022 | November | ||
2023 | April | ||
2023 | November | ||
2024 | April | ||
2024 | November | ||
2025 | April |
|
|
Elective: International Finance (CBCGS) | |||
Year | Month | Q.P. | Link |
IMP Q. |
|
| |
Obj. Q |
|
| |
2019 | April | ||
2019 | November | ||
2022 | November | Solution | |
2023 | April | ||
2024 | April | ||
2024 | November | Solution | |
2025 | April |
|
|
Elective: Brand Management (CBCGS) | |||
Year | Month | Q.P. | Link |
IMP Q. |
|
| Solution |
Obj. Q |
|
| Solution |
2019 | April | ||
2019 | November | ||
2023 | April | ||
2024 | April | ||
2024 | November | Solution | |
2025 | April | Solution | |
Elective: HRM in Global Perspective (CBCGS) | |||
Year | Month | Q.P. | Link |
IMP Q. |
|
| Solution |
Obj. Q |
|
| Solution |
2019 | April | ||
2019 | November | ||
2023 | April | ||
2024 | April | ||
2024 | November | Solution | |
2025 | April | ||
Elective: Innovation Financial Service (CBCGS) | |||
Year | Month | Q.P. | Link |
IMP Q. |
|
| Solution |
Obj. Q |
|
| Solution |
2019 | April | ||
2019 | November | ||
2023 | April | Solution | |
2024 | April | ||
2024 | November | Solution | |
2025 | April | Solution | |
Elective: Retail Management (CBCGS) | |||
Year | Month | Q.P. | Link |
IMP Q. |
|
| Solution |
Obj. Q |
|
| Solution |
2019 | April | ||
2019 | November | ||
2023 | April | ||
2024 | April | ||
2024 | November | ||
2025 | April | ||
Elective: Organizational Development (CBCGS) | |||
Year | Month | Q.P. | Link |
IMP Q. |
|
| Solution |
Obj. Q |
|
| Solution |
2019 | April | ||
2019 | November | ||
2023 | April | ||
2024 | April | ||
2024 | November | Solution | |
2025 | April |
| |
Elective: Project Management (CBCGS) | |||
Year | Month | Q.P. | Link |
IMP Q. |
|
| Solution |
Obj. Q |
|
| Solution |
2019 | April | ||
2019 | November | Solution | |
2023 | April | ||
2024 | April | ||
2024 | November | Solution | |
2025 | April |
| |
Elective: International Marketing (CBCGS) | |||
Year | Month | Q.P. | Link |
IMP Q. |
|
| Solution |
Obj. Q |
|
| Solution |
2019 | April | ||
2019 | November | ||
2023 | April | ||
2024 | April | ||
2024 | November | ||
2025 | April |
| |
Elective: HRM in Service Sector Management (CBCGS) | |||
Year | Month | Q.P. | Link |
IMP Q. |
|
| Solution |
Obj. Q |
|
| Solution |
2019 | April | ||
2019 | November | ||
2023 | April | ||
2024 | April | ||
2024 | November | ||
2025 | April |
| |
Elective: Strategic Financial Management (CBCGS) | |||
Year | Month | Q.P. | Link |
IMP Q. |
|
| Solution |
Obj. Q |
|
| Solution |
2019 | April | ||
2019 | November | ||
2023 | April | ||
2024 | April | ||
2024 | November | Solution | |
2025 | April |
| |
Elective: Media Planning (CBCGS) | |||
Year | Month | Q.P. | Link |
IMP Q. |
|
| Solution |
Obj. Q |
|
| Solution |
2019 | April | ||
2019 | November | ||
2023 | April | ||
2024 | April | ||
2024 | November | Solution | |
2025 | April |
| |
Elective: Workforce Diversity (CBCGS) | |||
Year | Month | Q.P. | Link |
IMP Q. |
|
| Solution |
Obj. Q |
|
| Solution |
2023 | April | ||
2024 | April | ||
2024 | November | ||
2025 | April |
| |
Elective: Financing Rural Development (CBCGS) | |||
Year | Month | Q.P. | Link |
IMP Q. |
|
| Solution |
Obj. Q |
|
| Solution |
2023 | April | ||
2024 | April | ||
2024 | November | ||
2025 | April |
| |
Elective: Sport Marketing (CBCGS) | |||
Year | Month | Q.P. | Link |
IMP Q. |
|
| Solution |
Obj. Q |
|
| Solution |
2023 | April | ||
2024 | April | ||
2024 | November | ||
2025 | April |
| |
Elective: HRM Accounting & Audit (CBCGS) | |||
Year | Month | Q.P. | Link |
IMP Q. |
|
| Solution |
Obj. Q |
|
| Solution |
2019 | April | ||
2019 | November | ||
2023 | April | ||
2024 | April | ||
2024 | November | Solution | |
2025 | April |
| |
Elective: Indirect Tax (CBCGS) | |||
Year | Month | Q.P. | Link |
IMP Q. |
|
| Solution |
Obj. Q |
|
| Solution |
2019 | April | ||
2019 | November | ||
2023 | April | ||
2024 | April | Solution | |
2024 | November | Solution | |
2025 | April |
| |
Elective: Marketing of Non-Profit Organization (CBCGS) | |||
Year | Month | Q.P. | Link |
IMP Q. |
|
| Solution |
Obj. Q |
|
| Solution |
2019 | April | Solution | |
2019 | November | Solution | |
2023 | April | Solution | |
2024 | April | ||
2024 | November | Solution | |
2025 | April |
| |
Elective: Indian Ethos in Management (CBCGS) | |||
Year | Month | Q.P. | Link |
IMP Q. |
|
| |
Obj. Q |
|
| |
2019 | April | ||
2019 | November | ||
2023 | April | ||
2024 | April | ||
2024 | November | Solution | |
2025 | April |
| |

.png)
.png)
)
0 Comments